CasaXPS (Computer Aided Surface Analysis for X-ray Photoelectron Spectroscopy)
Processing Software for XPS, AES, ToF-SIMS and More
CasaXPSは、現在30, 300回を超えて、世界中の論文で引用されている、XPSスペクトルにおける代表的な解析ソフトウェアです。その背景には、経験豊富な表面分析のXPSアナリストとの緊密なコラボレーション、表面分析研究者の目線で数々のツールの開発を重ね続け、今日さまざまな分野において数々の実績があります。X線光電子分光(XPS)、Auger電子分光 (AES) 、またToF-SIMSなどの表面分析業務に欠かせない、世界中から最も信頼され使われている解析ソフトウェアとして、これからも成長を続けていきます。
 |
CasaXPSスペクトル解析ソフトの特徴
表面化学分析における国際標データ・フォーマット「ISO 14976 VAMAS」ファイル形式ブラウザー
特定のサンプルに対するピークモデルの適合性を分析する豊富なツール軍を提供
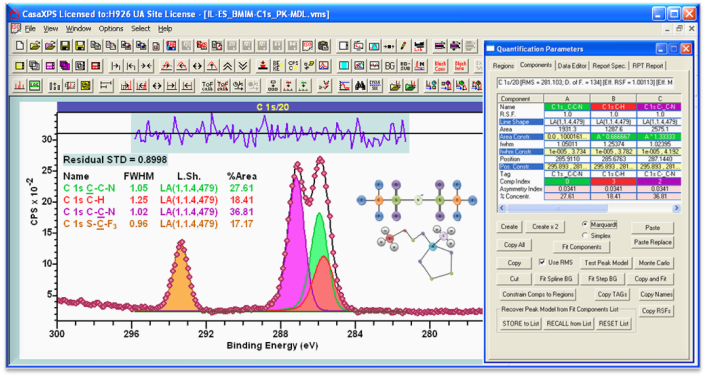
論文や出版物等用に、CasaXPSで解析結果を高画像データ (~600 DPI)で外部ファイルに出力
光電子放出のピークをモデル化するための、バックグラウンド補正オプションや、ラインシェープなど、広範囲に及ぶ解析オプションを提供
定性(サーベイ)や高分解能分析(ナロースキャン分析)の定量化
XPSの画像処理を完全装備。スペクトルと画像の両方の解析に適用できる多変量分析方法を使い、画像処理の可能性が最大に
世界中の表面計測装置の最新のバージョンに対応したデータ・コンバート機能を装備し、計測データをCasaXPS上に読み込み解析し、ISO 14976 VAMAS ファイルに出力、保存
独自に開発した Iterative SVD アルゴリズムを組み込み、空間的に分解されたスペクトルの処理時間が、劇的に改善し、大容量のデータセットの処理時間が快適に
バッチ処理による、繰り返し作業の自動化
CasaXPSは、Windows11を含むWindows95以上のオペレーションシステムで動作するWindowsプログラムです。
製品に関するご購入前のお問合せ、デモ使用のご依頼、ご購入手続き、またCasaXPSでの分析方法の技術的なアドバイスを、日本語でサポートいたしております。
お気軽に、日本語でお問合せください。
CasaXPS 最新技術を YouTube チャネルでビデオで紹介
CasaXPS の新機能は、CasaXPS Casa Software YouTube チャンネルにアップロードされたビデオを使用して説明されています。
既に 300 近いCasaXPS を使っての解析方法を説明したビデオが YouTube チャネルからご覧いただけます。
https://www.youtube.com/@casaxpscasasoftware4605
Examples of analyses performed in CasaXPS can be found in the following peer-reviewed papers.
[1] Fairley, Neal, et al. "Systematic and collaborative approach to problem solving using X-ray photoelectron spectroscopy." Applied Surface Science Advances 5 (2021): 100112.
[2] Moeini, Behnam, et al. "Definition of a new (Doniach‐Sunjic‐Shirley) peak shape for fitting asymmetric signals applied to reduced graphene oxide/graphene oxide XPS spectra." Surface and Interface Analysis 54.1 (2022): 67-77.
[3] Garland, Ben M., et al. "A study of in situ reduction of MoO3 to MoO2 by X-ray Photoelectron Spectroscopy." Applied Surface Science 598 (2022): 153827.
[4] Major, George H., et al. "Guide to XPS data analysis: Applying appropriate constraints to synthetic peaks in XPS peak fitting." Journal of Vacuum Science & Technology A: Vacuum, Surfaces, and Films 40.6 (2022): 063201.
[5] Smith, Emily, et al. "Modification of conventional peak shapes to accurately represent spectral asymmetry: High-Resolution X-ray photoelectron spectra of [C4C1Pyrr][NTf2] and [C8C1Im][NTf2] ionic liquids." Applied Surface Science 611 (2023): 155314.
[6] Major, George H., et al. "A detailed view of the Gaussian Lorentzian sum and product functions and their comparison with the Voigt function." Surface and Interface Analysis 54.3 (2022): 262-269.
[7] Fernandez, Vincent, Neal Fairley, and Jonas Baltrusaitis. "Surface analysis insight note: Synthetic line shapes, integration regions and relative sensitivity factors." Surface and Interface Analysis 55.1 (2023): 3-9.
[8] Fairley, Neal, et al. "Surface analysis insight note: Differentiation methods applicable to noisy data for determination of sp2‐versus sp3‐hybridization of carbon allotropes and AES signal strengths." Surface and Interface Analysis (2022).
[9] Fernandez, Vincent, et al. "Combining PCA and nonlinear fitting of peak models to re-evaluate C 1s XPS spectrum of cellulose." Applied Surface Science 614 (2023): 156182.
[10] Fairley, Neal, et al. "Practical guide to understanding goodness-of-fit metrics used in chemical state modelling of x-ray photoelectron spectroscopy data by synthetic line shapes using nylon as an example." Journal of Vacuum Science & Technology A: Vacuum, Surfaces, and Films 41.1 (2023): 013203.