Introduction
The following description represents an overview of the features and options within CasaXPS viewed from the perspective of the toolbar buttons, dialog windows and related menu items. The toolbar buttons are an important part of the user interface and provide short-cuts to many of the actions performed on the dialog windows.
The toolbar buttons are initially displayed at the top of the Main Program window and are activated or deactivated by left-clicking the mouse with the cursor over either the left-hand-side or the right-hand-side of an Experiment Frame (Figure 1). There are three possible toolbars. Anyone of these toolbars can be moved and re-positioned using the mouse or hidden from view using the toggle menu items on the View menu (Figure 2).

Figure 1: An Experiment Frame maximized within the CasaXPS Main Program window. The toolbar buttons state is shown following left-clicking the mouse over the bottom left tile in the left-hand-side of the Experiment Frame.

Figure 2: View Menu
Toolbar Buttons
Toolbar buttons are grouped within a toolbar based on the
type of actions performed by the buttons. The toolbar buttons and associated
dialog windows are discussed in the context of these groupings.
![]() Toolbar
options for transferring data into and out of CasaXPS
Toolbar
options for transferring data into and out of CasaXPS
![]() Creates a new empty Experiment Frame
Creates a new empty Experiment Frame
The New toolbar button creates an empty Experiment Frame.
Data from other open VAMAS files can be moved into an empty Experiment Frame,
which can serve as a temporary work area for analyzing data or form the basis
for collecting useful results for saving separately from the original data
files. Copying VAMAS blocks between Experiment Frames is facilitated by the![]() toolbar
button.
toolbar
button.
![]() Open one or more VAMAS files into individual
Experiment Frames
Open one or more VAMAS files into individual
Experiment Frames
A File dialog window appears in which one or more VAMAS files can be selected within a directory. On pressing the Open button, the data in the selected VAMAS files are displayed in separate Experiment Frames, one per selected VAMAS file. (See the Open and Merge option on the File menu for a means of collecting multiple VAMAS files into a single Experiment Frame.)
![]() Converts data from non-VAMAS format to VAMAS
format
Converts data from non-VAMAS format to VAMAS
format
Data in a wide range of file formats can be converted to VAMAS format via the Convert to VAMAS file File-dialog window. See the chapter on converting data formats.
There are two strategies for converting data files, where either the individual files are converted on a per file basis or alternatively a directory of data files are converted by a single action. The method used for any given format depends on the philosophy behind a given data format and how closely this philosophy matches the design of the ISO 14976 file format. The general rule for choosing the strategy is that individual files are converted whenever the individual files contain the experimental context for multiple acquisitions from a sample (e.g. a survey plus one or more high resolution spectra). Converting a directory of files approach applies to data such as VG Eclipse data, where each spectrum appears in a separate file within a directory.
The general approach to converting file formats is to supply a file extension using a File dialog window. For example, a directory of files containing X/Y pairs in ASCII format can be converted on mass into a single Experiment Frame by providing a new file name with a “.dat” file extension via the File Dialog window. The base name for the file name is not important, however the “.dat” extension to the specified file name causes the conversion to proceed on the basis that all the file in the current directory are ASCII X/Y pairs. A new VAMAS file is written into the current directory, so it is important that the user has write permission for the directory in question.
![]() Save as
Save as
![]() Copy to clipboard
Copy to clipboard
When an Experiment Frame is the sub-window with focus, the Copy button places a bitmap of the Active Tile on the clipboard. Once on the clipboard, the bitmap can be pasted into any program such as Microsoft Paint, Word, Excel or any other program accepting bitmaps from the clipboard. On pressing the Copy button, a dialog window appears in which the dimensions in pixels for the bitmap is specified. The plot in the Active Tile is scaled to fit the size of the bitmap defined by the dialog window.
If a Report Frame is the sub-window with focus, then pressing the Copy button results in a text dialog window, from which the tabulated information in the report can be placed onto the clipboard in a Tab spaced format suitable for spreadsheet programs.
![]() Copy EMF to clipboard from Active Tile
Copy EMF to clipboard from Active Tile
Using the drawing instructions for the Active Tile, copy an EMF to the clipboard.
Enhanced Meta Files are a mechanism used by Microsoft to transfer graphical information between programs. An EMF can be displayed in any program capable of interpreting these drawing instructions and so, in principle, an EMF is a compact method for transferring pictures between Microsoft programs. The EMF files generated by CasaXPS are created using the Microsoft Visual C++ compiler, however the underlying standard has changed over the years resulting in anomalous behaviour when a CasaXPS EMF is displayed in different versions of Word (for example). Switches for modifying the behaviour of the EMF file are included in CasaXPS, however it is not possible to create an EMF that works in Word 97 and also in Word 2000. The two main inconsistencies between different versions of Word are 1) the positioning of vertical text and 2) mirror text display. The former can be adjusted using the Vertical Text menu item on the File menu to force the vertical text to appear correct for one version of Word; unfortunately, if a Word document is subsequently sent to a person with an incompatible version of Word, the graphic, if left as an EMF insert, will appear incorrect to the observer. For this reason, the use of EMF files is not recommended for general use.
The problem of positioning vertical text is not confined to EMF visualization. An analogous issue exists for some printer drivers and therefore the Vertical Text menu item dialog window invoked from the File menu also provides a solution to the incorrect placement of vertical text on printed output.
![]() Copy Scrolled List to Clipboard as an EMF
Copy Scrolled List to Clipboard as an EMF
Using the drawing instructions for the entire set of tiles in the left-hand-side of the Experiment Frame, copy an EMF to the clipboard. See the above discussion relating to EMF from the Active Tile for caveats.
The example in Figure 3 is a graphic create using the Copy Scrolled List to Clipboard button, however the image has been converted to a bitmap via Microsoft Paint before including in a Word document.

Figure 3: Graphic originally created using an EMF on the clipboard.
![]() Save TAB spaced ASCII file
Save TAB spaced ASCII file
Data in a format suitable for import to Excel, Sigma Plot or Origin is output to an ASCII file using the Save TAB spaced ASCII file button. The resulting text file is created from those VAMAS blocks currently selected in the right-hand-side of the Experiment Frame, where separate tables are formatted from the data in each selected VAMAS block. The tables include the binding/kinetic energy, spectral intensities, background, each synthetic component in any peak model defined on the data and the total synthetic envelope. The table for each VAMAS block output includes columns using both counts-per-second and counts-per-bin.
![]() Copy TAB spaced ASCII to Clipboard
Copy TAB spaced ASCII to Clipboard
Tabulated data in a similar format to that generated by Save TAB spaced ASCII file is placed on the clipboard with the view to pasting into a spreadsheet or plotting program. The source for the data, however, is the spectrum in the Active Tile rather than the selected VAMAS blocks in the right-hand-side. Note that while the data displayed in a Clipboard Selection dialog window may appear misaligned, the columns of data are separated by tab spaces and will paste into most spreadsheets property aligned. The Clipboard Selection dialog window also allows the information to be saved to a text file.
![]() Save PHI
Save PHI
VAMAS formatted spectra can be exported in PHI Multipak format.
![]() Save data as individual VAMAS files
Save data as individual VAMAS files
Both buttons save the selected VAMAS blocks as a set of VAMAS files, where each VAMAS block becomes a separate file. Some programs are not capable of using VAMAS files unless the most basic use of the VAMAS format is employed to save the data. These two buttons provide alternative means of saving the VAMAS formatted data in an attempt to aid the exchange of data between programs. These options may be useful, for example, if spectra are required as input for the NPL transmission correction software.
![]() Save in QUASES format
Save in QUASES format
QUASES format relates to the program written by Sven Tougaard. A dialog window is invoked which offers two options for exporting the data:
- The Use Browser Selection tick-box is ticked. For each selected VAMAS block a QUASES formatted ASCII file is generated, where the file name of the new file(s) indicated the VAMAS block index and corresponding variable index for the source data.
- The Use Browser Selection tick-box is not ticked. The VAMAS file is assumed to be ordered consistent with spectra generated from an image data-set. A range of VAMAS blocks and corresponding variables are defined using two pairs of indices entered on the dialog window, such that when the OK button is pressed, the QUASES files are created based on the specified indices rather than the currently selected VAMAS blocks.
![]() Paste VAMAS formatted data from clipboard
Paste VAMAS formatted data from clipboard
Some acquisition systems, such as SPECSLAB II place data on the clipboard in VAMAS format. If the clipboard is loaded with VAMAS formatted data then pressing the Paste button on the toolbar will cause the data to appear in a new Experiment Frame in CasaXPS. A temporary file is used to keep a copy of the data on disk, however the data must be saved to an appropriate file following the paste operation or the VAMAS file will be lost.
![]() Paste data from clipboard
Paste data from clipboard
If VAMAS formatted data is placed on the clipboard, then pressing the Paste data toolbar button performs the same task as the Paste VAMAS formatted data paste button, however a File dialog window requires a disk file be associated with the Experiment Frame.
The Paste data button also allows data from RBD’s Auger Scan Software to be pasted from the clipboard into CasaXPS. The data appears in a new Experiment Frame and must be saved to a disk file at a later sage.
![]() Toolbar
options for invoking dialog windows
Toolbar
options for invoking dialog windows
The primary dialog windows for manipulating data are invoked
using these toolbar buttons. The Options menu (Figure 4) also provides similar
access to these same dialog windows.

Figure 4
![]() Page Layout
Page Layout

The scrolled-list of tiles in the left-hand-side of an Experiment Frame represents a sequence of pages and on pressing the Print toolbar button, spectra are printed using the tile layout currently used to view the data in the scrolled-list. A page corresponds to the set of tiles visible at any one time in the left-hand-side of the Experiment Frame. The Page Tile Format dialog window offers a set of default layouts for one or more display tiles per page. Each property page on the dialog window numbered 1 to 16 defines an array of non-overlapping display tiles, where initially the number of tiles in the array corresponds to the value used to label the property page. The format defined by a property page can be adjusted using the three sets of radio buttons. A format is defined by specifying the number of rows of tiles, then for each row the number of tiles to appear in each row. The number of rows can be selected from the Number of Rows/Column radio buttons. For each row from a possible maximum of four rows, the number of tiles within a row is assigned using the Tiles per Row/Column radio buttons. As an alternative, the definition for the tiles per page can be made using columns rather than rows. Switching the page layout between rows and columns is performed using the Tile Arranged in radio buttons.

Figure 5: Page Layout showing four tiles arranged using three rows with one, two and one tile per row, display using arrange in rows and then arrange in columns.
![]() Tile Display Parameters
Tile Display Parameters
The Tile Display Parameter dialog window offers a set of property pages for altering the appearance of the Active Tile.
X Axis Property Page
For display purposes, two strings are offered on the X Axis property page and are associated with the choice of binding or kinetic energy display for the energy axis. The convention in XPS is to display the binding energy axis as a decreasing energy scale; however if the core electrons are viewed as lower in energy than the more excited valence band electrons, then it is clear the convention for the binding energy scale is simply missing a minus sign. Thus both kinetic energy and binding energy scale should be seen as increasing energy scales. Binding energy is more commonly used for XPS because the positions of photoelectric lines with respect to the binding energy scale are independent of the X-ray photon energy. The opposite is true for Auger lines, that is, Auger lines always appear at the same positions on the energy scale with respect to the kinetic energy of the ejected electron. Hence AES data is displayed using the kinetic energy scale.
When a spectrum is plotted, the chosen energy type determines which of the two strings are displayed as the label to the X-axis. The font for the X-axis label is defined using a standard Font dialog window invoked by the Font button on the X-Axis property page. Once a font is chosen from the Font dialog window, it is necessary to press the OK or the Apply button on the Tile Display Parameters dialog window before the font in the Active Tile is changed. The energy range over which the spectrum is displayed is determined from the values entered in the Min and Max fields. The font used to display the X-axis numbers is also used to display the Y-axis numbers, therefore the button to make adjustments to the font used on the axes is located on the Display property page rather than on either the X-axis or Y-axis property pages.
It is also possible to reduce the complexity of the display by either removing the X-axis scale entirely or limiting the tick marks on the X-axis to only the major values. These options are available as tick-boxes on the property page.

Y Axis Property Page
The Y axis label and intensity range are analogous to the X axis property page; however there is an additional label associated with displaying the data using arbitrary units. The tick-box labeled Arbitrary Units removes the numerical scale from the intensity display and adds a third string as the Y axis label in preference to both the strings associated with the counts per second and counts per bin radio buttons. Arbitrary units (Figure 6) are useful when the data has been normalized in some way.
Two frequently used options on the Y axis property page are
the Normalise Display and Offset Spectra tick-boxes (also
available from the toolbar buttons![]() and
and ![]() ).
These options are often used when visually comparing overlaid spectra, where
the Offset Spectra tick-box creates a set of vertically offset plotting areas
within the Display Tile (Figure 7) and the Normalise
Display tick-box adjusts the intensities of each spectrum displayed in the tile
relative to the intensity of the first spectrum selected via the
right-hand-side of the Experiment Frame. The relative size of the plotting
areas and consequently the offset between these plotting areas is specified via
the % text-field adjacent to the Offset Spectra tick-box. The value entered in
the text-field specifies the percentage size of the plotting areas relative to
the size of the axes box in the Display Tile. If the Normalise Display option is also used, a vertical line marks the
point at which the data is scaled, where the scaling is performed so that the
traces all pass through the same point which intersects the vertical line. The
position of the vertical line can be adjusted by holding the Shift-key down and
then left-clicking the mouse with the cursor indicating the desired tie point.
When printed, the vertical line is not included on the output.
).
These options are often used when visually comparing overlaid spectra, where
the Offset Spectra tick-box creates a set of vertically offset plotting areas
within the Display Tile (Figure 7) and the Normalise
Display tick-box adjusts the intensities of each spectrum displayed in the tile
relative to the intensity of the first spectrum selected via the
right-hand-side of the Experiment Frame. The relative size of the plotting
areas and consequently the offset between these plotting areas is specified via
the % text-field adjacent to the Offset Spectra tick-box. The value entered in
the text-field specifies the percentage size of the plotting areas relative to
the size of the axes box in the Display Tile. If the Normalise Display option is also used, a vertical line marks the
point at which the data is scaled, where the scaling is performed so that the
traces all pass through the same point which intersects the vertical line. The
position of the vertical line can be adjusted by holding the Shift-key down and
then left-clicking the mouse with the cursor indicating the desired tie point.
When printed, the vertical line is not included on the output.
Zero Base-Line on
Zoom and Log Scale are two tick
boxes aimed at SIMS data; the former modifies the behaviour when using the
mouse to zoom into a peak. The default zoom behaviour uses the dimensions of
both the width as well as the height of the zoom rectangle, which is drawn
following dragging the cursor over a display tile. If the cursor is located
inside the defined zoom box when the left mouse button is clicked, then provide
the Zero Base-Line on Zoom tick box
is not ticked, the intensity range
defined by the zoom box is used to redisplay the data. Alternatively, if the Zero Base-Line on Zoom tick box is
ticked, then only the upper-most boundary of the zoom box defines the maximum
intensity when the data is redisplayed; the lower limit to the intensity scale
is always zero.


Figure 6: Arbitrary Units display.

Figure 7: Offset spectra using plotting areas 50% of the tile axes area.
Geometry Property Page
The Geometry property page provides the means to switch between the normal 2D graphical display used to display spectra overlaid on a single pair of axes and a 3D plot, where the axes are offset in both X and Y directions to provide a depth to the display determined by the values assigned to the experimental variable for each spectrum. When a set of spectra are plotted using the 3D option, the size and location of the axes used to draw the data are defined in terms of the Front Plane and the Back plane. When overlaid spectra are draw, the first spectrum in the list of selected blocks is drawn on a pair of axes positioned and scaled using the Scale X, Scale Y and Shift X parameters in the Front Plane Parameters section. Similarly the last spectrum in the list of selected blocks is drawn using a pair of axes positioned and scaled according to the same parameters as the Front Plane, but with the additional parameter of Shift Y. All other spectra within the selected blocks appear at axes positioned and scaled using a linear interpolation between these two defining planes. The parameters are percentage based, for example, Scale X 75 represents a set of axes where the size of the X direction is ¾ the size of the box which otherwise would have been used to plot the data in 2D mode. Once the Front and Back planes are shrunken down to some percentage of the surrounding box, the position of the reduced axes are defined using the convention that -100 positions the shrunken plane all the way to the left of the surrounding box, while +100 shifts the shrunken plane entirely to the right. Figure 8 shows a display where the Front plane is scaled in both X and Y using 75 and shifted in X by -80.
The toolbar button![]() toggles between the three display-modes 2D, 3D and Factor Space.
toggles between the three display-modes 2D, 3D and Factor Space.


Figure 8: 3D plot of overlaid spectra, where the Front Plane is of size 75% of the enclosing box in both X and Y directions.
Display Property Page
The display characteristics of the Active Tile are adjusted
using the Display property page. The extensive array of tick-boxes permits the
inclusion or exclusion of information on the drawing area. Some display
properties are also toggled using toolbar buttons![]() ,
where pressing these toolbar buttons cycles through various combinations of the
tick-box setting. For example, pressing the
,
where pressing these toolbar buttons cycles through various combinations of the
tick-box setting. For example, pressing the ![]() button
initially removes the background colour used to define the range over which a
quantification region computes a background, a second press returns the
background colour previously removed but removes the region name label and a
third press removes both region colour and also the region name string from the
display. A fourth button press returns both the region colour and also the
region name label. These toolbar button actions could be explicitly defined
using the two tick-boxes Quant. Regions
and Quant Region Labels on the
Display property page.
button
initially removes the background colour used to define the range over which a
quantification region computes a background, a second press returns the
background colour previously removed but removes the region name label and a
third press removes both region colour and also the region name string from the
display. A fourth button press returns both the region colour and also the
region name label. These toolbar button actions could be explicitly defined
using the two tick-boxes Quant. Regions
and Quant Region Labels on the
Display property page.

The Display Tick-Boxes
![]() When ticked, the Title tick-box causes the
title string to be displayed above the plotting area in a Tile. The source for
the title is either the text-field on the Display property page
When ticked, the Title tick-box causes the
title string to be displayed above the plotting area in a Tile. The source for
the title is either the text-field on the Display property page  or if the Use Id Title tick-box is ticked,
then the title is constructed from the Block identifier and Sample identifier
strings in the source VAMAS block. The font for the title string is also
defined using a standard Font dialog window. Note, the font specified through
the Font dialog window only takes effect following pressing of the OK or Apply
buttons on the Tile Display Parameters dialog window.
![]() When ticked, the comment text lines maintained
by the VAMAS block are displayed above the graph area.
When ticked, the comment text lines maintained
by the VAMAS block are displayed above the graph area.
![]() When ticked, the acquisition parameters for
the data displayed in the tile are printed above the graph area.
When ticked, the acquisition parameters for
the data displayed in the tile are printed above the graph area.
![]() The font used to display both the VAMAS block
comment text and the acquisition parameters is altered using the Font dialog
window invoked by the Header Font button.
The font used to display both the VAMAS block
comment text and the acquisition parameters is altered using the Font dialog
window invoked by the Header Font button.
![]() When ticked, the annotation defined by the
Annotation dialog window is displayed on the data in the tile. Note, not all
text on the display derives from the Annotation dialog window, e.g. component
and region name text.
When ticked, the annotation defined by the
Annotation dialog window is displayed on the data in the tile. Note, not all
text on the display derives from the Annotation dialog window, e.g. component
and region name text.
![]() When ticked, annotation tables such as
components, regions and quantification tables are not displayed in the tile.
When ticked, annotation tables such as
components, regions and quantification tables are not displayed in the tile.
![]() When ticked, the name fields from any
quantification regions are displayed on the spectra. Labels from quantification
regions do not derive from the Annotation dialog window and are therefore
unaffected by the Annotation tick-box above. The
When ticked, the name fields from any
quantification regions are displayed on the spectra. Labels from quantification
regions do not derive from the Annotation dialog window and are therefore
unaffected by the Annotation tick-box above. The ![]() toolbar
button alters the state of the tick-box
toolbar
button alters the state of the tick-box
![]() The name fields for individual components can
be turned on an off as text labels for each component displayed in a tile. The
mechanism for switching these component labels on and off is selecting the
components via the table on the Components property page of the Quantification
Parameters dialog window. When a component is selected, by left-clicking a
given column on the Components property page, the tick-box on the Display
property page becomes enabled and the selected component label is toggled on or
off. The set of component labels currently displayed can all be turn off by
un-ticking the Component Labels tick-box on the Display property page. The
labels only appear in a tile when the Component Labels tick-box is ticked.
The name fields for individual components can
be turned on an off as text labels for each component displayed in a tile. The
mechanism for switching these component labels on and off is selecting the
components via the table on the Components property page of the Quantification
Parameters dialog window. When a component is selected, by left-clicking a
given column on the Components property page, the tick-box on the Display
property page becomes enabled and the selected component label is toggled on or
off. The set of component labels currently displayed can all be turn off by
un-ticking the Component Labels tick-box on the Display property page. The
labels only appear in a tile when the Component Labels tick-box is ticked.
![]() When ticked, the labels for the quantification
regions, if enabled, are printed in a vertical direction.
When ticked, the labels for the quantification
regions, if enabled, are printed in a vertical direction.
![]() When ticked, the energy limits to a
quantification region are displayed on a spectrum using a different background
colour to the default tile background colour. These colours are defined using
the Colour property page on the Tile Display Parameters dialog window. The
When ticked, the energy limits to a
quantification region are displayed on a spectrum using a different background
colour to the default tile background colour. These colours are defined using
the Colour property page on the Tile Display Parameters dialog window. The ![]() toolbar
button alters the state of the tick-box.
toolbar
button alters the state of the tick-box.
![]() When ticked, components defined on a spectrum
are displayed. The
When ticked, components defined on a spectrum
are displayed. The ![]() toolbar
button also toggles the display of the component by altering the state of the
Display tick box.
toolbar
button also toggles the display of the component by altering the state of the
Display tick box.
![]() When ticked, the residual plot representing
the difference between the data and the total synthetic envelope is plotted
along the top of the tile.
When ticked, the residual plot representing
the difference between the data and the total synthetic envelope is plotted
along the top of the tile.
![]() When ticked, the residual plot is normalized
with respect to the expected noise in the data. Poisson counting statistics
imply the noise and therefore the un-normalized residual is largest where the
counts are highest. Normalizing the residual produces an even appearance to the
residual plot regardless of the counts per bin. If the counts per bin are
unknown, then the residual should be plotted with the Normalise Residual button
un-ticked.
When ticked, the residual plot is normalized
with respect to the expected noise in the data. Poisson counting statistics
imply the noise and therefore the un-normalized residual is largest where the
counts are highest. Normalizing the residual produces an even appearance to the
residual plot regardless of the counts per bin. If the counts per bin are
unknown, then the residual should be plotted with the Normalise Residual button
un-ticked.
![]() When ticked, the background to the spectrum
computed from the quantification region parameters is displayed on the graph.
When ticked, the background to the spectrum
computed from the quantification region parameters is displayed on the graph.
![]() When ticked and header information from the
VAMAS comment and/or the acquisition parameters are enabled, a box or boxes are
drawn around the displayed header information between the title and the axes
box.
When ticked and header information from the
VAMAS comment and/or the acquisition parameters are enabled, a box or boxes are
drawn around the displayed header information between the title and the axes
box.
![]() When ticked, for each major tick mark on the
axes, horizontal and vertical dashed lines are drawn (Figure 9).
When ticked, for each major tick mark on the
axes, horizontal and vertical dashed lines are drawn (Figure 9).

Figure 9: Axes Major Lines ticked displays horizontal and vertical dotted lines for each major tick mark on the axes.
![]() When ticked, the rectangle defining the
drawing area in a tile is drawn.
When ticked, the rectangle defining the
drawing area in a tile is drawn.

Figure 10: Spectrum tile illustrating the case where the Draw Graph Box is not ticked.
![]() When ticked, the graphical area used to
display the data is reduced to half the size of the tile area. While the graph
itself appears in the top half of the tile, annotation defined on the VAMAS
block can be moved below the graphical area as shown in Figure 11, where both a
table of components and a text have been placed outside the graphical area used
to plot the spectrum.
When ticked, the graphical area used to
display the data is reduced to half the size of the tile area. While the graph
itself appears in the top half of the tile, annotation defined on the VAMAS
block can be moved below the graphical area as shown in Figure 11, where both a
table of components and a text have been placed outside the graphical area used
to plot the spectrum.

Figure 11: Half Tile Display showing annotation positioned below the graphical display.
![]() When ticked, two rectangular planes, beneath
and at the rear of the spectra are filled with a colour defined on the Colour
property page. If un-ticked the display appears as seen in Figure 12 compared
to the display in Figure 8. Note, Figure 12 is drawn using the Draw Graph Box
un-ticked, thus only axes appear on the 3D plot.
When ticked, two rectangular planes, beneath
and at the rear of the spectra are filled with a colour defined on the Colour
property page. If un-ticked the display appears as seen in Figure 12 compared
to the display in Figure 8. Note, Figure 12 is drawn using the Draw Graph Box
un-ticked, thus only axes appear on the 3D plot.

Figure 12: 3D display mode where the Draw 3D Planes tick-box is un-ticked and the Draw Graph Box tick-box is un-ticked too. Compare to Figure 8 above.
![]() When ticked, a spectrum is drawn using the
data points connected by line segments.
When ticked, a spectrum is drawn using the
data points connected by line segments.
![]() When ticked and Draw Lines is not ticked, the
data points appear as symbols with connecting line segments, one symbol per
data point. If tick together with Draw Lines, a reduced number of symbols are
drawn at regular intervals and the data points are connected using line
segments.
When ticked and Draw Lines is not ticked, the
data points appear as symbols with connecting line segments, one symbol per
data point. If tick together with Draw Lines, a reduced number of symbols are
drawn at regular intervals and the data points are connected using line
segments.

Figure 13: Spectra drawn using Draw Lines and Draw Points ticked. Header information is also added to the display using the Vamas Block Comment and Acquisition Parameters tick boxes. The key is added to the display using the Draw Key tick box.
![]() The Fill
Below tick box results in different plots depending on the state of the Draw Lines and Draw Points tick boxes. If the Draw
Lines tick box is ticked at the same time as the Fill Below tick box, then the area between the graph and the X axis
is filled with the colour determined from the 3D Fill button on the Colour property page (Figure 14). An
alternative drawing mode results if the Fill
Below tick box is ticked and the Draw
Points tick is ticked whilst the Draw
Lines tick box is not. Under these circumstances, the data points are used
to draw sticks from the data point to the X axis as shown in the Inset Tile in
Figure 14.
The Fill
Below tick box results in different plots depending on the state of the Draw Lines and Draw Points tick boxes. If the Draw
Lines tick box is ticked at the same time as the Fill Below tick box, then the area between the graph and the X axis
is filled with the colour determined from the 3D Fill button on the Colour property page (Figure 14). An
alternative drawing mode results if the Fill
Below tick box is ticked and the Draw
Points tick is ticked whilst the Draw
Lines tick box is not. Under these circumstances, the data points are used
to draw sticks from the data point to the X axis as shown in the Inset Tile in
Figure 14.

Figure 14: Fill Below ticked. The parent tile is displayed using both the Draw Lines and Draw Points tick boxes ticked, while the inset tile is plotted with the Draw Lines un-ticked and the Draw Points tick box ticked.
![]() When ticked, a key or legend is added to the
display of two or more spectra (Figure 14). The default source for the text is
the Block Id for the VAMAS block containing the data and is therefore the
string used to display the VAMAS block in the right-hand-side of the Experiment
Frame. The block identifier can be adjusted using the following toolbar buttons:
When ticked, a key or legend is added to the
display of two or more spectra (Figure 14). The default source for the text is
the Block Id for the VAMAS block containing the data and is therefore the
string used to display the VAMAS block in the right-hand-side of the Experiment
Frame. The block identifier can be adjusted using the following toolbar buttons:
![]() or
or![]() .
.
![]() When ticked, the key or legend is positioned in
the top-left side of the graphical area; otherwise the key appears in the
top-right-hand side of the graphical area.
When ticked, the key or legend is positioned in
the top-left side of the graphical area; otherwise the key appears in the
top-right-hand side of the graphical area.
![]() When ticked, the text appearing in the key or
legend derives from the first line of the VAMAS block comment
When ticked, the text appearing in the key or
legend derives from the first line of the VAMAS block comment![]() .
.
![]() When ticked, the text appearing in the key or
legend derives from the Sample Id VAMAS block field. The Sample Id text may
appear as an alternative to the Block Id or in conjunction with the Description
Key tick box text.
When ticked, the text appearing in the key or
legend derives from the Sample Id VAMAS block field. The Sample Id text may
appear as an alternative to the Block Id or in conjunction with the Description
Key tick box text.
![]() When ticked, the current experimental variable
is appended to the text appearing in the key.
When ticked, the current experimental variable
is appended to the text appearing in the key.
![]() When ticked, synthetic components defined on
the first spectrum of several spectra displayed in a tile are displayed over
the data. This tick box is used when fitting a set of linked components that
span multiple acquisition regions.
When ticked, synthetic components defined on
the first spectrum of several spectra displayed in a tile are displayed over
the data. This tick box is used when fitting a set of linked components that
span multiple acquisition regions.
![]() When ticked, the index with respect to the
VAMAS file displayed in the Experiment Frame appears in the top-left-hand side
of the graphical area. Data in a VAMAS files is specified by two indices, the
VAMAS block index and the corresponding variable index within a given VAMAS
block. Displaying data derived from the corresponding variables is achieved by
holding the Control Key down and pressing the PageUp and PageDown buttons on
the keyboard. Control Home and Control End move to the first and last
corresponding variables in a VAMAS block. The transmission function for a
spectrum, if present in the VAMAS block, appears as the second corresponding
variable indexed 1 (Figure 15).
When ticked, the index with respect to the
VAMAS file displayed in the Experiment Frame appears in the top-left-hand side
of the graphical area. Data in a VAMAS files is specified by two indices, the
VAMAS block index and the corresponding variable index within a given VAMAS
block. Displaying data derived from the corresponding variables is achieved by
holding the Control Key down and pressing the PageUp and PageDown buttons on
the keyboard. Control Home and Control End move to the first and last
corresponding variables in a VAMAS block. The transmission function for a
spectrum, if present in the VAMAS block, appears as the second corresponding
variable indexed 1 (Figure 15).

Figure 15: Transmission data viewed from VAMAS block with index 47 appearing in the corresponding variable with index 1.
![]()
![]() When tick and the line width is one or zero
When tick and the line width is one or zero ![]() ,
then the synthetic components or the spectra are drawn using a range of line
styles.
,
then the synthetic components or the spectra are drawn using a range of line
styles.
![]() The font used to display the numerical values
associated with the X and Y axes are adjusted using the resulting Font dialog
window. The font only takes affect following pressing the OK or the Apply
button on the Tile Display Parameters dialog window.
The font used to display the numerical values
associated with the X and Y axes are adjusted using the resulting Font dialog
window. The font only takes affect following pressing the OK or the Apply
button on the Tile Display Parameters dialog window.
Colour Property Page

The Colour property page offers a means for adjusting the colours used to display spectra and related information in the display tiles. The set of buttons on the property page all use the standard Microsoft Color dialog window, however two modes of operation are used depending on whether the button selected adjusts one colour or a set of colours. If one colour is involved, for example the Tile Background colour, then simply selecting a colour from any of the colour squares on the Color dialog window and pressing the OK button will alter the parameter, however the colour displayed by the tile is only updated once the OK or Apply button is pressed on the Tile Display Parameter dialog window. The alternative mode involved sets of colours rather than individual colours. For Example, a range of colours are used to display overlaid spectra, therefore the important colours are those appearing in the Custom Color palette on the Color dialog window. There are sixteen colours available for definition via the extended section of the Color dialog window and these colours are used to display overlaid spectra in the order top-left to top-right, then bottom-left to bottom-right. The button labeled Define Custom Colors, when pressed, reveals a mechanism for making adjustments to the current palette of Custom Colors. Click a colour square from the set of Custom Colors, adjust the colour using the cursor over the large coloured square, then press the Add to Custom Colors button. Once all the changes to the custom color palette are made, press the OK button on the Color dialog window. Again, the tile display is only updated once the OK or Apply button is pressed on the Tile Display Parameters dialog window.
Global Property Page

The Tile Display Parameter dialog window alters the display settings for the Active Tile. If however, the settings prepared and applied to the Active Tile are also applicable to other tiles currently displayed in the left-hand-side of the Experiment Frame, then the Global property page can be used to apply these new settings to all the tiles in the scrolled list.
When applying certain display setting to a range of tile, not all the display settings are necessarily appropriate. For example, if two tiles exist displaying an O 1s and a C 1s peak, then although the desire to unify the spectrum colour used to display both spectra is valid, accepting a single range of energies for the X axis is not. Similarly, the intensity range may be inappropriate as well as unifying the title. These display settings are generally excluded when the display settings are applied to a range of tiles, however to accommodate the situation where these parameters are intended to be updated too, there are a set of tick-boxes which when tick, explicitly specify that these parameters should also be applied together with all the other tile display parameters.
The Global property page also offers a means of saving default settings for the tile display between CasaXPS sessions. The directory containing the CasaXPS.exe program also contains a directory called CasaXPS.DEF, in which a set of configuration files are stored. Once the tile display in terms of fonts, colours and display options is established for the Active Tile, then pressing the buttons on the Global property page will save most display settings to disk. On restarting CasaXPS, the saved display settings are read and used to display the data.
![]() Quantification Parameters Dialog Window
Quantification Parameters Dialog Window

Quantification regions, synthetic components, data editing, satellite subtraction and the generation of quantification reports are all featured on the Quantification Parameters dialog window. The Quantification Parameters dialog window is central to the analysis of spectra; so much so that entire chapters are devoted to the uses and implications of the options on this dialog window.
![]() Spectrum Processing Dialog Window
Spectrum Processing Dialog Window

The Spectrum Processing window has become a misnomer since both spectra and images are manipulated via options on this window. The property pages on the Spectrum Processing dialog window are predominantly for processing spectra, but nevertheless certain features are also useful for manipulating images, most notably the processing history.
When data within CasaXPS is manipulated in any way, the original raw data is saved in memory and the displayed data derives from the processed data. Operations performed on the data via the Spectrum Processing dialog window are recorded using a list of instruction known as the processing history. The processing instructions for a piece of data are listed on the Processing History dialog window, from which the processing can be modified and re-applied to the raw data. Making any adjustment to the processing history involves returning the processed data to the initial raw data, then re-application of each command in the processing history list. Note, not all processing commands can be applied in this way. For example, any calculator operation cannot be re-applied because the computation requires the knowledge of other VAMAS blocks within a file or even from other files and therefore cannot be performed in a safe manner. If data is processed via other means, for example image arithmetic or altered using the Data Editor property page on the Quantification Parameters dialog window, then the raw data can be reinstated by pressing the Reset button on the Processing History property page.
The set of property pages on the Spectrum Processing dialog window include options with sufficient depth of content to require sections and chapters devoted to their use.
![]() Annotation Dialog Window
Annotation Dialog Window
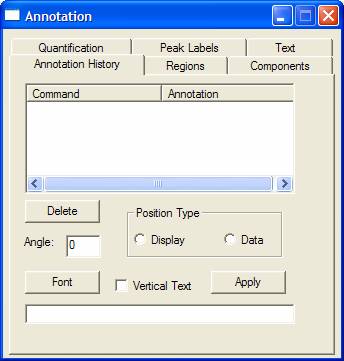
Annotation for spectra is managed using an analogous mechanism to the processing history. Each piece of annotation, when applied to a spectrum, is added to an annotation history, which appears in a list on the Annotation History property page and can be adjusted or deleted using options on the property page. Annotation can take the form of quantification tables, created using options on the Quantification, Regions and Components property pages or text for labeling the data. The uses and issues associated with the use of annotation tables is discussed elsewhere.
Annotation is added to a spectrum by pressing the Apply button found on each of the property pages on the dialog window. A new entry will appear in the Annotation History list each time an Apply button is pressed. If the annotation so created does not appear on the display, check the state of the Annotation tick-box on the Display property page of the Tile Display Parameters dialog window. To see the annotation within a tile, the tick-box must be ticked. In addition to listing the set of annotation defined on a spectrum, the Annotation History property page allows various attributes associated with the annotation to be changed. For example, the font used to display text is altered by selecting an item in the scrolled-list, then choosing a new font via the Font dialog window invoked by the Font button, followed by pressing the Apply button on the Annotation History property page.
Moving annotation is also performed when the Annotation History property page is the active page on the Annotation dialog window. Under these circumstances, each piece of annotation displayed on a spectrum is also accompanied by a small square with a dot inside the square, which appears near the top left-hand side of annotation tables (Figure 16). Dragging the cursor starting at one of these squares causes the annotation to move to wherever the drag motion ends.
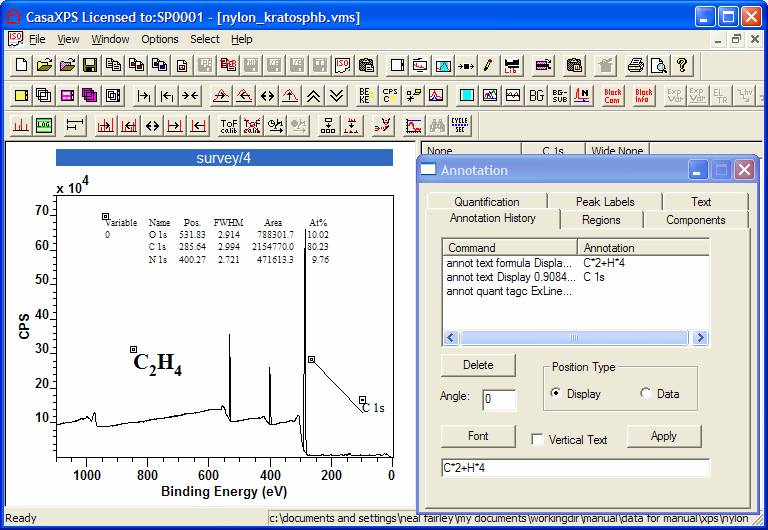
Figure 16: Spectrum illustrating the location boxes available only when the Annotation History property page is active.
![]() Element Library Dialog Window
Element Library Dialog Window
The Element Library dialog window provides the means to qualitatively assess the composition of a survey spectrum. A combination of a scrolled-list of transitions (Element Table property page) linked to the energy scale of a spectrum and selecting elements from the Periodic Table property page permit transition markers to appear over the data. By matching these markers to the peaks, the composition of a surface can be assessed. A complete description of the Element Library can be found elsewhere.

Image Processing
Dialog Window
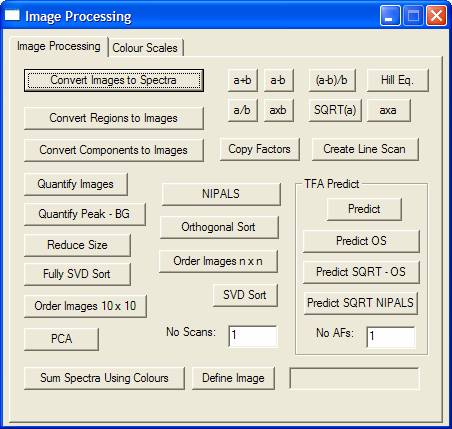
Available from the Options menu, the Image Processing dialog window provides a range of options for manipulating image data sets. The image processing options require detailed descriptions given elsewhere.
![]() Toolbar
option used to propagate a set of commands to other spectra within a file or to
spectra in other files
Toolbar
option used to propagate a set of commands to other spectra within a file or to
spectra in other files
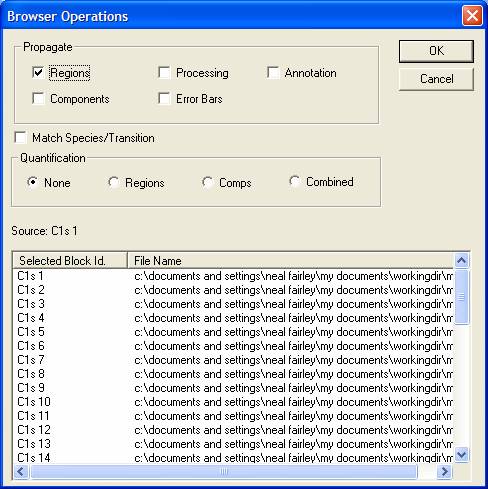
Processing, quantification regions, synthetic components and annotation prepared on a spectrum can be propagated to other spectra requiring the same actions. Once the analysis of spectrum is complete, spectra within the same file or from other files can be selected (using the right-hand-side of the Experiment Frames open in CasaXPS) and by giving focus to the Active Tile displaying the prepared spectrum then pressing the propagate toolbar button, the processing etc associated with the Active Tile is transferred to the selected VAMAS blocks. The Browser Operations dialog window invoked by the toolbar button displays the block identifier of the source VAMAS block and also a list of the target VAMAS blocks. The types of action to propagate are chosen using tick-boxes in the Propagate section of the dialog window.
![]() Add
to and Deleting VAMAS Blocks from an Experiment Frame
Add
to and Deleting VAMAS Blocks from an Experiment Frame
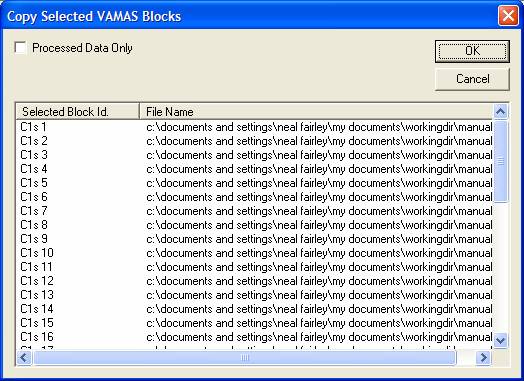
VAMAS blocks can be moved between Experiment Frames by first
selecting the VAMAS blocks using the right-hand-side of the Experiment Frames,
passing focus to the Experiment Frame to which the data are to be transferred,
then pressing the![]() toolbar button. A dialog window appears listing all the VAMAS blocks currently
selected. On pressing the OK button on the dialog window the data are copied
into the Experiment Frame with focus. The tick-box labeled Processed Data Only switches between copying the raw data plus the
processing command from each of the source VAMAS blocks and copying the
processed data only. The consequence of ticking the Processed Data Only tick
box is that the new VAMAS block has no record of the processing steps used to
prepare the data and only contains the processed data. For example, if the
desire is to copy satellite subtracted data to a new file, the satellites can
be removed using the temporary data manipulation option and once all operations
have been performed successfully, the satellite subtracted data copied to a new
Experiment Frame using the Processed
Data Only tick box, thus providing a permanent record of the processed spectra.
toolbar button. A dialog window appears listing all the VAMAS blocks currently
selected. On pressing the OK button on the dialog window the data are copied
into the Experiment Frame with focus. The tick-box labeled Processed Data Only switches between copying the raw data plus the
processing command from each of the source VAMAS blocks and copying the
processed data only. The consequence of ticking the Processed Data Only tick
box is that the new VAMAS block has no record of the processing steps used to
prepare the data and only contains the processed data. For example, if the
desire is to copy satellite subtracted data to a new file, the satellites can
be removed using the temporary data manipulation option and once all operations
have been performed successfully, the satellite subtracted data copied to a new
Experiment Frame using the Processed
Data Only tick box, thus providing a permanent record of the processed spectra.
Similarly, VAMAS blocks can be deleted from the current
Experiment Frame with focus. Simply, selecting the VAMAS blocks in the
right-hand-side of the Experiment Frame and press the delete toolbar button![]() ultimately
removes the selected VAMAS blocks from the Experiment Frame. A confirmation
dialog window will offer a second chance to reconsider the action, however
should the delete action be confirmed, the selected VAMAS blocks are
permanently removed from the Experiment Frame.
ultimately
removes the selected VAMAS blocks from the Experiment Frame. A confirmation
dialog window will offer a second chance to reconsider the action, however
should the delete action be confirmed, the selected VAMAS blocks are
permanently removed from the Experiment Frame.
An alternative strategy for collecting VAMAS blocks from
more than one file is to use the Open
and Merge menu option on the File menu. The use of this option requires all
the VAMAS files to be gathered together in a directory. A selection of files
all located in the same directory can be made using the Merge VAMAS Files
dialog window invoked by the Open and Merge menu option. Use of the Shift key
and the Control Key allows multiple files to be selected prior to pressing the
Open button. Each file selected will appear in the same new Experiment Frame,
where each set of VAMAS blocks from the original individual files are assigned
a unique index value as the experimental variable.
![]() Print
and print preview toolbar buttons
Print
and print preview toolbar buttons
All the display tiles currently loaded into the left-hand-side of the Experiment Frame are printed when the Print toolbar button is pressed.
It is worth noting that, if Adobe Acrobat is installed on
the PC running CasaXPS, the Adobe Acrobat Distiller option appears as a
possible printer on the Print dialog window. The Adobe Acrobat Distiller allows
the display tiles in the scrolled list in the left-hand-side of the Experiment
Frame to be converted to PDF format and saved to disk.
![]() About
CasaXPS toolbar button
About
CasaXPS toolbar button
Offers the current version number and also allows the licensing information to be entered for a PC.
![]() Toolbar
buttons for displaying VAMAS blocks in the scrolled list of display tiles
Toolbar
buttons for displaying VAMAS blocks in the scrolled list of display tiles
These toolbar buttons are used to display VAMAS block data in the left-hand-side of the Experiment Frame. The first step is to select the VAMAS blocks using the right-hand-side of the Experiment Frame, then the selected data are displayed by pressing the appropriate toolbar button for the desired action.
![]() For each VAMAS block selected in the
right-hand-side of the Experiment Frame a new display tile is create. A new
scrolled list is created in the left-hand-side of the Experiment Frame in which
a tile is created for each of the selected VAMAS blocks and one spectrum/image
appears in each tile. The display settings last in use are used to initialize
the newly created tiles.
For each VAMAS block selected in the
right-hand-side of the Experiment Frame a new display tile is create. A new
scrolled list is created in the left-hand-side of the Experiment Frame in which
a tile is created for each of the selected VAMAS blocks and one spectrum/image
appears in each tile. The display settings last in use are used to initialize
the newly created tiles.
![]() One or more spectra/images are overlaid in
the Active Tile. Select the VAMAS blocks in the right-hand-side of the
Experiment Frame then select the Active Tile from the possible tiles already displayed
in the left-hand-side. On pressing the toolbar button, the data from the
selected VAMAS blocks are displayed overlaid in the Active Tile. To alter the
data in a given display tile, simply left-click the tile, select the VAMAS
block and press the toolbar button. When more than one VAMAS blocks are
selected, the order in which the blocks are selected in the right-hand-side
determines the order of the data in the Active Tile.
One or more spectra/images are overlaid in
the Active Tile. Select the VAMAS blocks in the right-hand-side of the
Experiment Frame then select the Active Tile from the possible tiles already displayed
in the left-hand-side. On pressing the toolbar button, the data from the
selected VAMAS blocks are displayed overlaid in the Active Tile. To alter the
data in a given display tile, simply left-click the tile, select the VAMAS
block and press the toolbar button. When more than one VAMAS blocks are
selected, the order in which the blocks are selected in the right-hand-side
determines the order of the data in the Active Tile.
![]() Identical in operation to the
Identical in operation to the ![]() toolbar buttons, respectively, however the
current energy and intensity ranges, if possible, are used to display the data.
toolbar buttons, respectively, however the
current energy and intensity ranges, if possible, are used to display the data.
![]() Using the selected VAMAS blocks, this toolbar
button initializes the scrolled list of tiles in the left-hand-side of the
Experiment Frame, creating a new tile for each row of VAMAS blocks within the
right-hand-side of the Experiment Frame. These new tiles are themselves
initialized by overlaying the data from each row of VAMAS blocks selected at
the time the button is pressed.
Using the selected VAMAS blocks, this toolbar
button initializes the scrolled list of tiles in the left-hand-side of the
Experiment Frame, creating a new tile for each row of VAMAS blocks within the
right-hand-side of the Experiment Frame. These new tiles are themselves
initialized by overlaying the data from each row of VAMAS blocks selected at
the time the button is pressed.
![]() Toolbar
buttons for manipulating the zoom list.
Toolbar
buttons for manipulating the zoom list.
![]() Using the left mouse button, drag out a box
over a spectral feature of interest. On pressing the toolbar button the axes
are rescaled to the ranges for energy and intensity defined by the zoom box
previously marked in the graphical area of the tile. Each new such zoom action
causes an additional zoom state to be added to the current zoom list.
Using the left mouse button, drag out a box
over a spectral feature of interest. On pressing the toolbar button the axes
are rescaled to the ranges for energy and intensity defined by the zoom box
previously marked in the graphical area of the tile. Each new such zoom action
causes an additional zoom state to be added to the current zoom list.
![]() After zooming into a region of a display tile,
pressing this toolbar button steps back through the list of zoom states.
Repeatedly pressing the Zoom out toolbar button cause the zoom state to appear
in a cyclical order.
After zooming into a region of a display tile,
pressing this toolbar button steps back through the list of zoom states.
Repeatedly pressing the Zoom out toolbar button cause the zoom state to appear
in a cyclical order.
![]() Reset or re-initialize the zoom-list. If a
spectrum already has quantification regions defined, then pressing the Reset
toolbar button initializes the zoom list using the energy interval extracted
from the start and end parameters defined for the quantification regions.
Reset or re-initialize the zoom-list. If a
spectrum already has quantification regions defined, then pressing the Reset
toolbar button initializes the zoom list using the energy interval extracted
from the start and end parameters defined for the quantification regions.
![]() Toolbar buttons for moving the current display
zoom-state in energy and intensity.
Toolbar buttons for moving the current display
zoom-state in energy and intensity.
![]() Toolbar buttons for toggling through display
options, e.g. switching between binding and kinetic energy for the abscissa.
Toolbar buttons for toggling through display
options, e.g. switching between binding and kinetic energy for the abscissa.
![]() Toolbar buttons for invoking dialog windows
for editing/viewing VAMAS block information such as the VAMAS block comment and
experimental acquisition fields.
Toolbar buttons for invoking dialog windows
for editing/viewing VAMAS block information such as the VAMAS block comment and
experimental acquisition fields.
![]() Edit VAMAS Block Comment
Edit VAMAS Block Comment
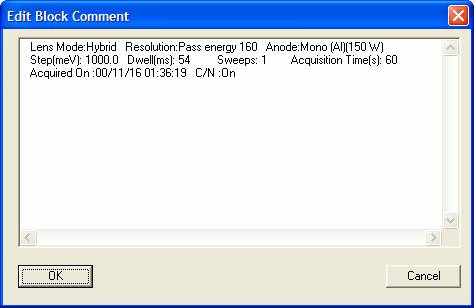
Each VAMAS block includes as set of comment lines. These
comment lines are edited in CasaXPS using the dialog window invoked by the ![]() toolbar button. The comment lines can be added
to display tiles in the form of a header and the first line of the comment can
also be used to create a legend for overlaid spectra.
toolbar button. The comment lines can be added
to display tiles in the form of a header and the first line of the comment can
also be used to create a legend for overlaid spectra.
To edit the VAMAS block comment lines, display the data from the VAMAS block in the Active Tile and select the toolbar button. The current comment lines are displayed in a text-edit window ready for editing, after which the results can be saved in the VAMAS block by pressing the OK button on the dialog window.
![]() Edit VAMAS Block Fields
Edit VAMAS Block Fields
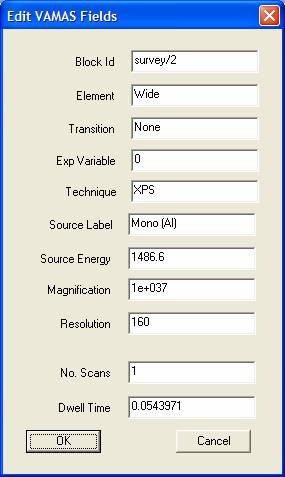
Experimental information is collected in each VAMAS block. These VAMAS block fields take many forms and while in theory should be fully defined by the original data file, the details may be incomplete. For this reason, some of the VAMAS block fields are offered for viewing and editing on a dialog window. Several of these VAMAS fields are also offered for editing on other more specific dialog windows; however the Edit VAMAS Fields dialog represents the most general means of modifying the experimental information.
To view or modify the VAMAS fields, display the target VAMAS block in the Active Tile then press the toolbar button. The most common fields requiring adjustment are the Block Id, the Element and Transition fields plus the experimental variable value. Care should be exercised with other field as these may affect quantification and energy calibration.
![]()
![]()
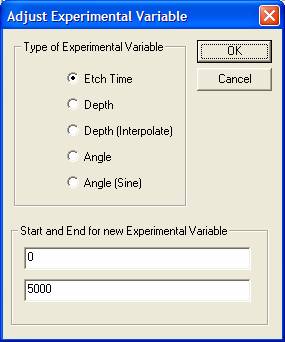
The toolbar button in question offers a means of globally altering the value for the current experimental variable in all VAMAS blocks in a file. The radio buttons specify the nature and type for the experimental variable. As an example, consider a depth profile in which narrow scan spectra are repeatedly acquired interleaved by etch cycles of a given duration. Figure 17 presents the data from such a profile experiment, however ultimately the idea is to plot the trends measured from the spectra as a function of depth rather than etch-time. The simplest way to convert the etch-time to depth is to enter the initial and final depths for the crated etched during the course of the experiment, select the Depth radio button on the dialog window, and then press the OK button. The Depth option assumed the rows are equally spaced in depth, however this is not always true. The etch-time between acquisition cycles may not be uniform and therefore a second option Depth (Interpolate) uses the etch time to compute the depth increments between acquisition cycles. The former method is used when the rows are assigned an experimental variable value which does not correspond to etch-time, for example if a set of data were collected from a set of X/Y pair ASCII files without the required etch-time information; in which case, the initial experimental variable may be data set index.
Two other options for setting the experimental variable are Angle and Angle (sine). The former assigns a range of linearly spaced values to the existing rows, while the latter generates row values which are the sine of a linear sequence of steps determined by the start and end values in the range text fields.
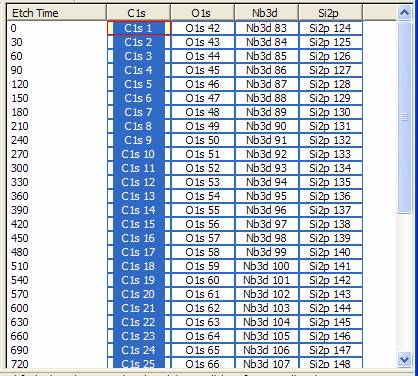
Figure 17: Logical structure of a depth profile VAMAS file.
![]()
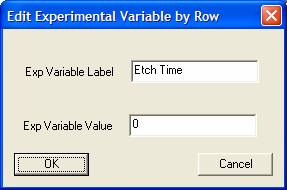
The experimental variable fields in a VAMAS block help to define the context for an acquisition. Within CasaXPS, the VAMAS blocks are aligned in the right-hand-side of the Experiment Frame using the value from the current experimental variable from each VAMAS block and since data can only be quantified with respect to each other when the corresponding blocks all appear in the same row on the right-hand-side, it is important to be able to make adjustments to these values. Experimental variables values, such as those in Figure 17, appear in a nature sequence of increasing etch-times; however, not all such sequences necessarily increase with row position and generally, CasaXPS does not assume any ordering of the VAMAS blocks with respect to these values. The only assumption is that VAMAS blocks with the same experimental variable should appear, whenever possible, on the same row in the right-hand-side of the Experiment Frame. Provided all VAMAS blocks with the same experimental variable have distinct species/transition fields, the blocks when viewed in the Experiment Frame will appear in the same row. There is a subtle but important difference between the Edit Experimental Variable by Row dialog window and all other means of changing an experimental variable value in a block, namely, the VAMAS blocks within the underlying file structure are re-ordered with respect to the newly assigned experimental value, whereas all other adjustments to these same values leave the underlying order of the blocks unchanged. Forcing the order for the blocks to change is useful in situations where the structure of the file does not properly reflect the experiment and sadly, not all file formats contain the full context for an experiment, thus necessitating such adjustments.
To change one or more experimental variables in a set of VAMAS blocks, select the appropriate set of blocks in the right-hand-side of the Experiment Frame and press the toolbar button. A new label for the experimental variable heading may be entered and the new value assign via the dialog window. On pressing the OK button, the value is assigned to the selected VAMAS blocks and the full set of blocks is reordered to reflect the numerical ordering in the context of the new values.
![]()
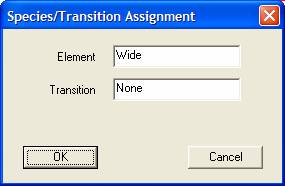
Element/transition or species/transition VAMAS block fields for the current selection in the right-hand-side of the Experimental Frame are adjusted using the strings entered in the Element and Transition text-fields on the dialog window. The alignment of the VAMAS blocks displayed in the Experiment Frame into columns is determined from the Species and Transition block strings. A new column appears for each VAMAS block with distinct pairs of these strings. For example, two blocks identified as Si 2p and Si 2p/1 would appear in separate columns in the right-hand-side of the Experiment Frame, therefore the use of these strings becomes important for rearranging data in preparation for quantification.
![]()
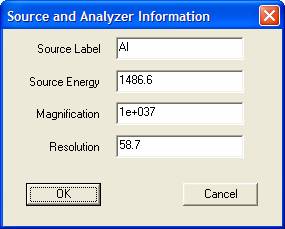
Other information often missing for data converted via X/Y pair ASCII files relate to the X-ray anode type (Source Label), photon energy (Source Energy), electron optics magnification and pass energy of retard ratio (Resolution). Again, these values can be assigned to the current selection of VAMAS blocks in the Experiment Frame, however when assigning a new x-ray source, be sure all the spectra selected have the same Magnification and Resolution settings.
![]()
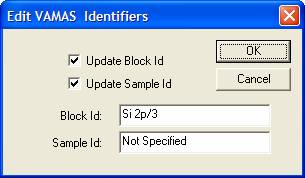
The Block Id is the string that appears in the array of
rectangles representing the VAMAS blocks in the right-hand-side of an
Experiment Frame. In addition to the Block Id, the Sample Id is a further sting
entered into each VAMAS block offering a means of characterizing the data using
a text string. The Sample Id is used to construct legends for overlaid spectra
and also aligning the VAMAS blocks in the Experiment Frame when Edit Mode is
enabled![]() .
.
The dialog window offers a pair of strings and two tick-boxes so that a chose can be made with respect to which of the strings are used when the OK button is pressed. The VAMAS blocks updated with the new values can be selected in as many Experiment Frames as desired. That is to say, the assignment is not restricted to the blocks selected in the Experiment Frame currently with focus.
![]()
The Edit Mode toolbar button switches the state of the first column in the right-hand-side of the Experiment Frame between using the experimental variable to order the rows and the strings held in the Sample Id. When pressed once, the experimental variable values are replaced by a set of row labels and these row labels may be edited simply by double-clicking the mouse with the cursor over a row label. See the section on Edit Mode for further details.
SIMS Toolbar
Buttons
![]() SIMS toolbar display options.
SIMS toolbar display options.
![]() SIMS toolbar options for stepping through the
mass range of a SIMS spectrum.
SIMS toolbar options for stepping through the
mass range of a SIMS spectrum.
![]() ToF SIMS mass calibration options.
ToF SIMS mass calibration options.
![]() Toolbar options for displaying sub-regions of
a SIMS spectrum and partitioning data into separate VAMAS blocks.
Toolbar options for displaying sub-regions of
a SIMS spectrum and partitioning data into separate VAMAS blocks.
![]() Invokes the ISS calibration dialog window.
Invokes the ISS calibration dialog window.
![]() Invokes the dynamic SIMS depth and intensity
calibration dialog window.
Invokes the dynamic SIMS depth and intensity
calibration dialog window.
![]() Search the VAMAS block comments for user
defined strings.
Search the VAMAS block comments for user
defined strings.