PMMA Degradation Study using Peak Model Constraints
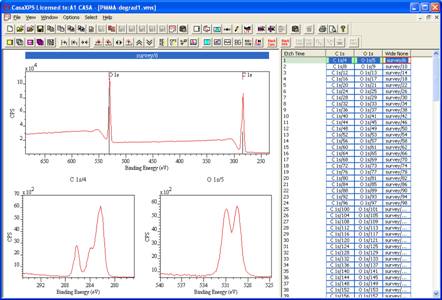
The experiment consists of repeated measurements of C 1s, O 1s high resolution narrow scan spectra (pass energy (PE) 20) and a survey spectrum (PE 160) from the same PMMA sample. The data set consists of 202 measurements performed on a Kratos Axis Ultra. The objective of the analysis is to investigate the consequences of x-ray exposure to PMMA during extended measurements typically required to generate imaging data sets suitable for spatially resolved chemical state analysis.
The technique used to analyse these data is based on linking peak models between the high resolution C 1s and O 1s spectra. The assumption is oxygen is lost through x-ray exposure of PMMA and therefore the C 1s data envelope evolves with time while the O 1s data envelope remains essentially PMMA in nature. The assumption as stated may be incorrect; nevertheless making such an assumption allows the procedure in CasaXPS to be illustrated. The simplified assumption is therefore a tool to permit the steps in CasaXPS to be explained.
The
following steps lead to an experiment frame containing spectra suitable for
linking components between the C 1s and O 1s energy intervals.
1. Select the two columns of VAMAS blocks containing the C 1s and O 1s spectra.
3. Invoke the Spectrum Processing dialog window and select the Test Data property page.
4. Press the button labelled Merge Raw. A set of VAMAS blocks are added to the current experiment frame.
Developing the Peak Model for both C 1s and O 1s Data Envelopes
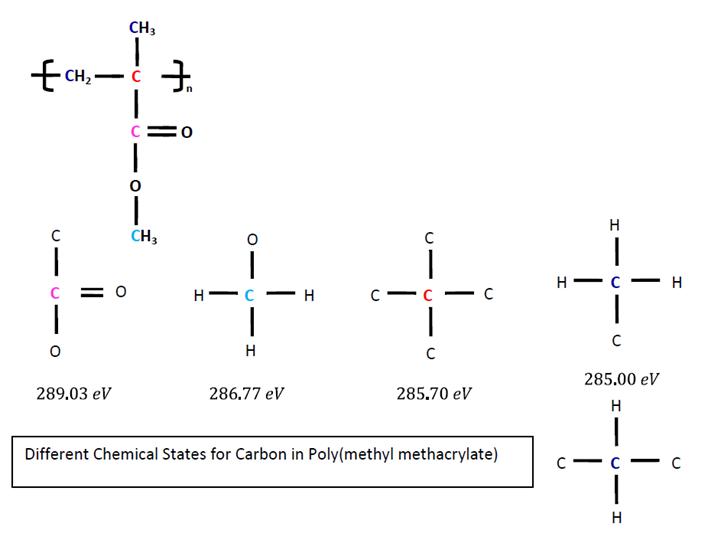
PMMA consists of five carbon atoms compared to two oxygen atoms. The oxygen atoms appear in two chemical states, namely, O singly bonded to carbon and O doubly bonded to carbon. The five carbon chemical states are illustrated below, where the chemical energy shift between two of these states is sufficiently small to represent both these states using a single component peak in the C 1s analysis. The carbon peaks are therefore expected to occur in the ratio 1:1:1:2.
Since there are two O 1s chemical states, namely, C-O=C and C-O-C, the O 1s data envelope can be modelled using two synthetic components.
The objective for the analysis of both these C 1s and O 1s peaks is to better understand how these peaks alter due to x-ray exposure. As the PMMA is irradiated the changes in the peak shapes with time are apparent when the data set are plotted overlaid as shown below.
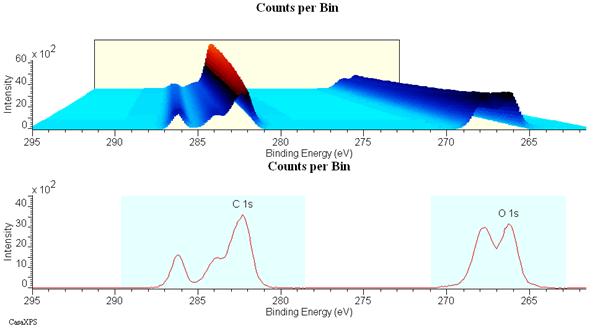
The C-C/C-H peak in the C 1s envelope increases with time while the O 1s peak intensity clearly decreases with x-ray exposure time. To quantify these changes the standard model for PMMA will be replaced by a single peak for the C-C/C-H transitions and the introduction of intensity constraints between the C 1s and O 1s peaks representing the C=O and C-O bonds. Again, it should be emphasized these are assumptions aimed at illustrating features in CasaXPS and should not be seen as illustrating how to analyse PMMA. Nevertheless, with these rather simple-minded assumptions the trends observed in the spectra can be quantified in terms of intensity ratios suggesting what changes in the sample should be given further attention.
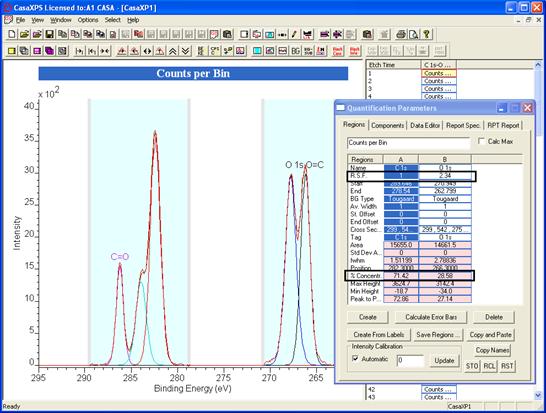
To begin the analysis the area constraint between the O 1s and C 1s peaks corresponding to the O-C and O=C bonds must be assessed. The regions from the data for the “as received” PMMA provide an estimate for these constraints. In principle there should be 5 carbon atoms to 2 oxygen atoms in the PMMA polymer. This stoichiometry is obtained based on the first spectrum in the series if an RSF relative to the C 1s transition for the O 1s peak area is assigned a value of 2.34
 .
.
The constraint which must be introduced for the components
representing the C=O bonded atoms must be such that the component area
parameter not only accounts for the relative sensitivity of the transitions but
also allows for the transmission function changes between the energies for the
O 1s and C 1s electrons. The area constraint in this example between O 1s peak
area (as specified as a peak parameter) and the corresponding C 1s peak is ![]() where the number
where the number ![]() is calculated from the region
quantification table.
is calculated from the region
quantification table.
The model as described above is
implemented by entering the string B*2.41 into the area constraint field in
column D on the Components property page. Column B lists the peak parameters
for the C 1s C-O component while column D contains the parameters for the O 1s
peak corresponding to C-O bond.
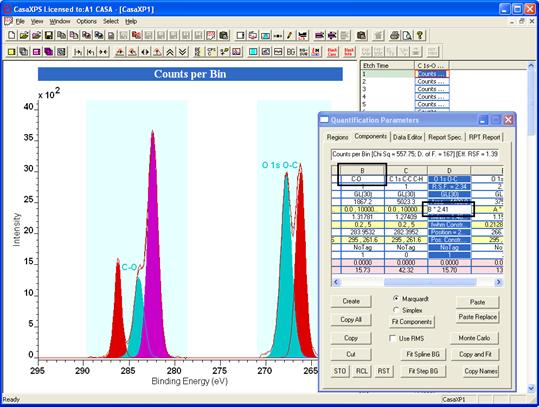
A similar constraint is applied between the C 1s and O 1s peaks corresponding to the O=C bond in the PMMA polymer. Once the peaks and the constraints are established on the first PMMA spectrum, the same model can be propagated to all the PMMA-like spectra in the data set.
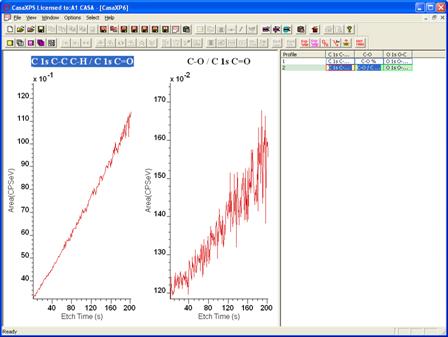
The profile results obtained by calculating the ratio of the C 1s C-C/C-H peak shows an increasing intensity relative to the C=O peak intensity. The result is to be expected given the 3D plots above, however the C-O peak also changes in intensity relative to the C=O peak, which was not so obvious from inspecting the spectra alone.